

A City in the Sea
Reviewing Charleston's 2023 flood events

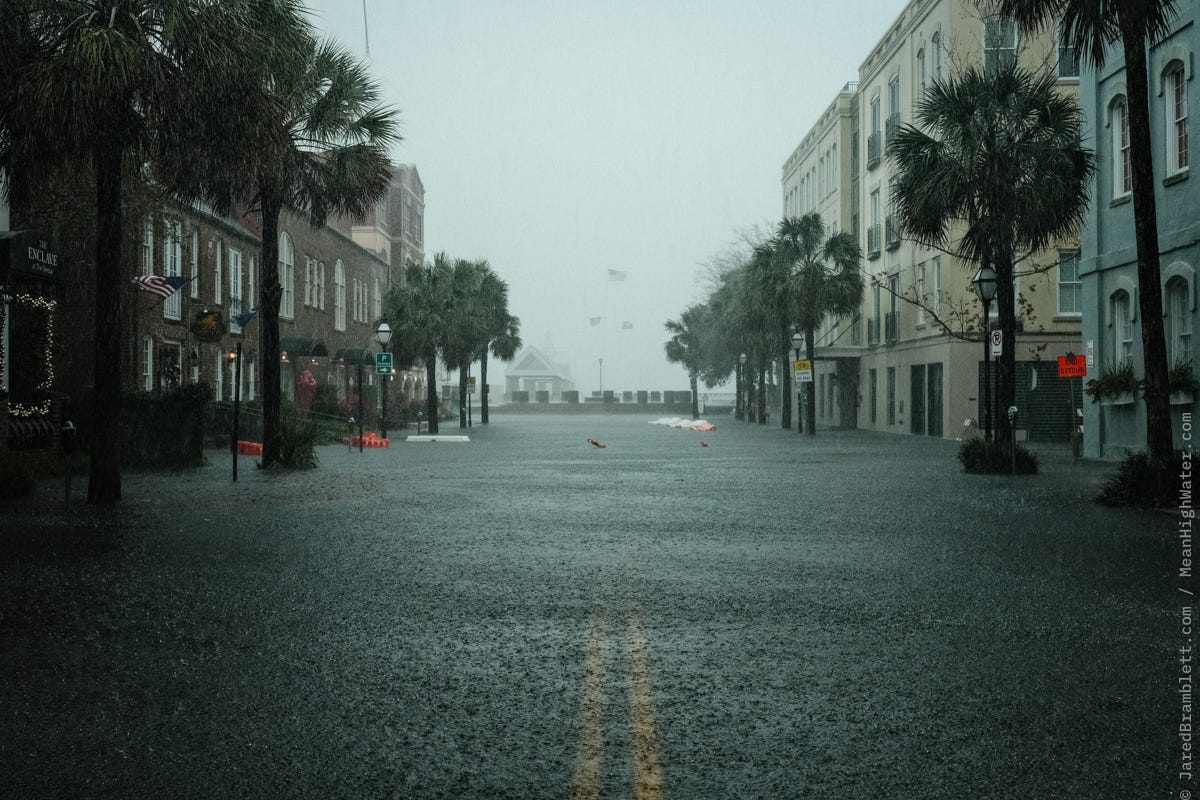
Charleston is increasingly becoming a city in the sea. This past year saw above-average rainfall, a continued increase in the frequency of tidal flooding, and a few historic flood events. As 2023 comes to a close, here is a review of when and how Charleston flooded over the past year.
Rainfall & Stormwater Flooding
National Weather Service (NWS) records for Downtown Charleston and North Charleston indicate above-average rainfall for the year. There were 49.32 inches recorded Downtown, which is just over 5 inches above the historic average of 44.26 inches. In North Charleston, there were 54.64 inches compared to the historic average of 52.41 inches.
I do not remember (and I did not document) many stormwater floods this year, and digging into the monthly data backs this up. There were only three days downtown (8/16, 9/17, 12/17) and six days in North Charleston (2/11, 6/23, 8/30, 7/9, 7/17, 12/17) where greater than two inches of rainfall fell. There were also three days of daily-record rainfall in downtown (4/22, 8/16, 12/17) and in North Charleston (2/11, 7/23, 12/17).
The most impactful stormwater flooding on the Peninsula occurred on September 17th. Officially, 2.89 inches were recorded at Waterfront Park, but personal weather stations reporting on Weather Underground’s Wundermap indicate between 3.3 and 4.1 inches across with peninsula with peak instantaneous rainfall rates between 3.8 and 5.9 inches per hour. Luckily, most of the heaviest rains occurred at low tide, which allowed the flood waters to discharge into the Ashely and Cooper rivers as the rainfall rates subsided.


This flood event was the first test of the City’s $200-million Spring/Fishburne Drainage Improvement Project, and the good news is that it significantly reduced flood depths and durations from the storm. Four phases of the five-phase project have been completed, with only the construction of the pump station remaining. Since the flooding occurred during low tide, it allowed the tunnel’s outfall to discharge more runoff to the river than the smaller, older drainage system. The photos below show areas in Westside that would have normally been flooded, but the new drainage system allowed the areas to drain much faster.


Tidal Flooding
The NWS monitors tide levels at the US Customs House in Downtown Charleston, and they define tidal flooding as tides exceeding 7 feet, moderate tidal flooding as tides that exceed 7.5 feet, and major tidal flooding as tides that exceed 8 feet (on the Mean Lower Low Water or MLLW datum). NWS records show that 2023 was the second-most active year for tidal flooding with 75* tidal flood events (there were 89 in 2019), tied for the most active year of moderate tidal flood events with 26 (there were also 26 in 2019), and second-most active year with 6 major tidal flood events (there were 7 in 2020). The chart below shows the number of tidal flood events per year down by flooding category (flooding, moderate flooding, and major flooding).
*This is a preliminary estimate as December’s tidal floods have not been confirmed by NWS at the time of publication.
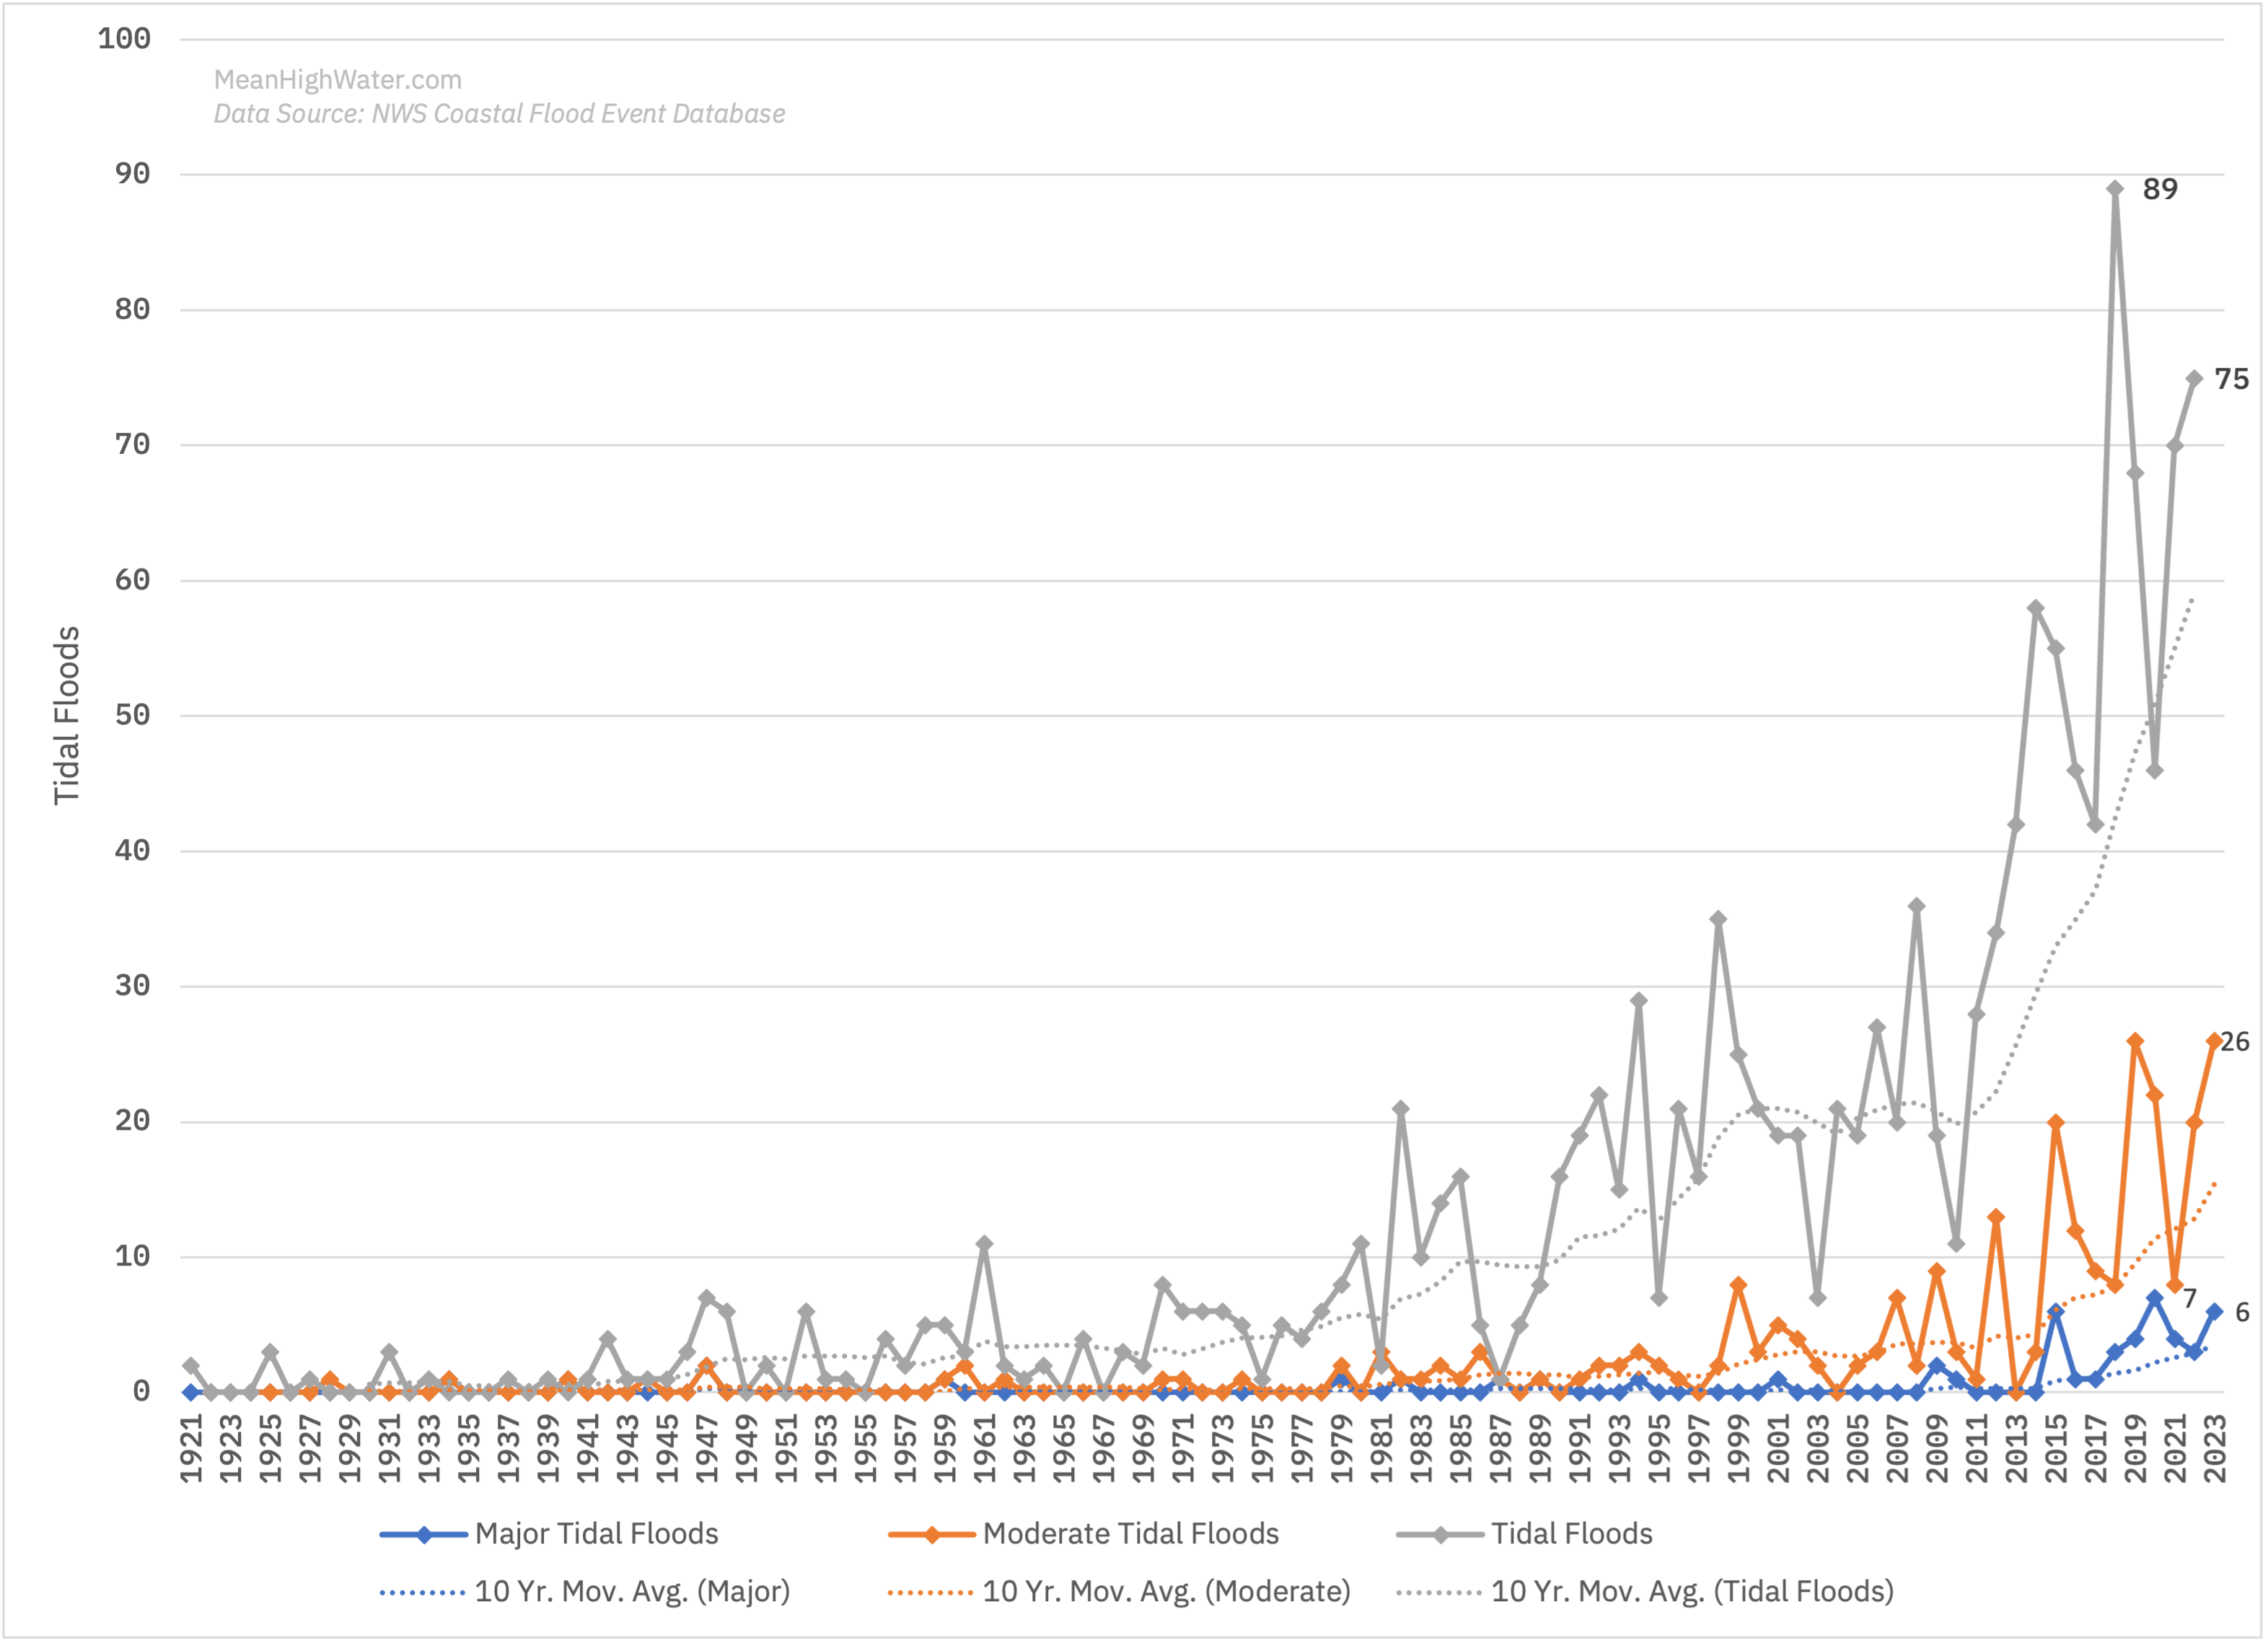
The 10-year moving average trendlines for the three classifications of tidal floods have been included in the figure above, and they show an alarming trend. Before 1945, there were few tidal flood events, and the trend hovered near zero. Between 1945 and 1959, the 10-year moving average increased to roughly 3 events per year and then increased to roughly 4 events per year between 1959 and 1971. From 1971 to 1999, the trend increased from 4 to 20 events per year, and then it leveled out with an average of approximately 20 events per year from 1999 to 2011. Since 2011, the increase in the trend has accelerated from 20 to 69 events per year.
Major tidal floods, or tides that exceed 8’ MLLW, are the most impactful, and the rate of increase in their occurrences is concerning. There have been 49 major tidal floods since 1921, with 35 of them (71.4%) occurring since 2015. 20 of them (40.8%) have occurred since 2020.


Two Historic Tidal Floods
2023 saw the 4th and 6th highest tides ever recorded in Charleston Harbor.
Idalia
On August 30th, Hurricane Idalia impacted the Charleston Area as a tropical storm. August 30 was also a full moon, and the 8:24 PM high tide was project as a ‘king tide’. The timing of the storm occurred around the PM high tide, which resulted in water levels at the Customs House reaching 9.23 feet (MLLW). At the time it was the 5th highest tide on record. Luckily, most of the rain with the storm occurred earlier during the day, so stormwater flooding did worsen the tidal flooding.


December Nor’easter
During my 16 years living in Charleston, I’ve never heard of a nor’eastern as being a concern for the region, but that’s how the NWS referred to the storm that impacted the area on December 17, 2023. The resulting storm tide reached 9.86 feet (MLLW), which is the 4th highest tide on record. Additionally, between 3 and 5 inches of rain fell around the peak tide, and significant compound flooding impacted the region for hours. You can read a full summary of the storm here.


Moving Forward
2023 continued to show that we must figure out ways to adapt to live with more water in the Holy City. It’s impossible to know what is in store for 2024, but the Post & Courier recently published an article discussing how El Nino is likely to result in a wetter winter and spring. Let’s hope that doesn’t mean an increase in flooding across the city. Astronomically, there are 26 predicted ‘king tides’ for 2024, but we’re likely to see a lot more than 26 tidal floods. There were only 21 astronomical ‘king tides’ in 2023, and we ended up with 75 tidal floods.